SQL Dump - Part 2
Description
A mix of SQL problems that involves aggregate functions, joins, and window functions.
Problems
Enterprise Data Sets on SQL Server
Database: Dillards
1.What total quantity of products from brand Nike that has been sold to date?
(Note: each record in the TRANSACT table is a single sale of an item. Label your result
column UNITS_SOLD.)
SQL Query:
SELECT COUNT(TRANSACT.TRANSACTION_ID) AS UNITS_SOLD
FROM SKU
    LEFT JOIN TRANSACT ON SKU.SKU = TRANSACT.SKU
WHERE SKU.BRAND_NAME = 'NIKE'
GROUP BY SKU.BRAND_NAME;

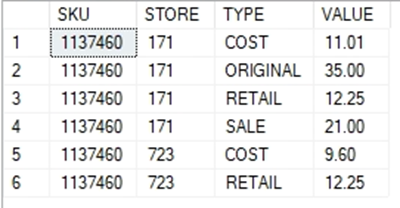
2. We received a request from our pricing manager for a report containing separate
rows for every type of price record and value for a product. Let’s start by writing a
query just for product SKU 1137460, and two stores: 171 and 723. The result should
contain four columns: the SKU, the STORE, a column specifying the type of price
record (cost, retail, original, or sale - these are in the SKU_STORE and TRANSACT
tables), and another column with the price value. Duplicate rows should not be
included, but any type of record may have multiple results.
(HINT: each type of price record is a separate query, and we need to combine the results into a single list).
SELECT SKU, STORE,'RETAIL' AS TYPE, RETAIL AS 'VALUE'
FROM SKU_STORE
WHERE SKU = '1137460' AND STORE IN (171 , 723)
UNION
SELECT SKU, STORE, 'ORIGINAL', ORIG_PRICE
FROM TRANSACT
WHERE SKU = '1137460' AND STORE IN (171 , 723)
UNION
SELECT SKU, STORE, 'SALE', SALE_PRICE
FROM TRANSACT
WHERE SKU = '1137460' AND STORE IN (171 , 723)
UNION
SELECT SKU, STORE,'COST', COST
FROM SKU_STORE
WHERE SKU = '1137460' AND STORE IN (171 , 723);
Database: Sam’s Club
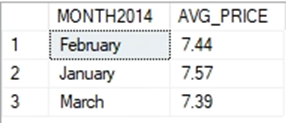
3. We want to look at meat price trends. What was the average retail price for
BOLOGNA by month between January and March of 2014?
Note: this data set only contains those months but include them in your query
constraints for completeness.
SELECT DATENAME(MONTH,VISIT_DATE) AS MONTH2014 ,
CAST(AVG(RETAIL_PRICE) AS DECIMAL(4,2)) AVG_PRICE
FROM ITEM_SCAN
    INNER JOIN ITEM_DESC ON ITEM_SCAN.SCAN_ID = ITEM_DESC.ITEM_NBR
WHERE ITEM_DESC.PRIMARY_DESC = 'BOLOGNA' AND VISIT_DATE BETWEEN
'2014-01-01' AND '2014-03-31'
GROUP BY DATENAME(MONTH,VISIT_DATE);
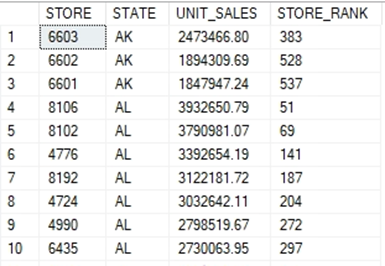
4. Produce a store ranking report, with each store’s rank based on unit sales (sum of item quantity) within their state and overall for the company. Order the report by state and rank within the state.
SELECT STORE_INFO.STORE_NBR AS STORE, STATE, SUM(UNIT_QTY) AS
UNIT_SALES,
RANK() OVER(ORDER BY SUM(UNIT_QTY) DESC) AS STORE_RANK
FROM STORE_INFO, ITEM_SCAN
WHERE STORE_INFO.STORE_NBR = ITEM_SCAN.STORE_NBR
GROUP BY STATE, STORE_INFO.STORE_NBR
ORDER BY STATE, UNIT_SALES DESC, STORE_RANK;
Enterprise Data Sets on Teradata
Database: Dillards
5. Compare our Black Friday weekend sales for 2014 (11/28 to 12/1, 2014) and 2015
(11/27 to 11/30, 2015). You can either provide a total value across these days for
each year, or the values for each day.
Note: Teradata date formats can be a little tricky. You can use the DATE function to convert a string value to a date for
comparison (e.g., WHERE TRAN_DATE >= DATE ‘2015-11-27’).
DATABASE WCOB_DILLARDS;
SELECT SUM(TRAN_AMT) AS BLACK_FRIDAY_SALE
FROM TRANSACT
WHERE TRAN_DATE >= DATE'2014-11-28' AND
TRAN_DATE <= DATE'2014-12-01'
UNION
SELECT SUM (TRAN_AMT)
FROM TRANSACT
WHERE TRAN_DATE >= DATE '2015-11-27' AND
TRAN_DATE <= DATE '2015-11-30';

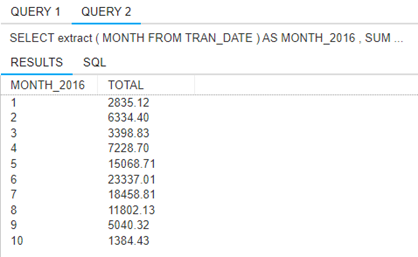
6. Was there an increase in AMERICA-themed apparel leading up to the 2016
election? Look for any SKU with a color description containing ‘AMERICA’, and
return the total transaction amounts for these items by month for the year 2016.
Order the results by month.
Note: Teradata date formats are tricky here as well. In SQL Server, the YEAR() and MONTH() functions are very simple. The equivalent for MONTH(TRAN_DATE) in
Teradata is EXTRACT(MONTH from TRAN_DATE). Also, the data ends mid-October, so you should only see numbers for the first 10 months.
DATABASE WCOB_DILLARDS;
SELECT extract(MONTH FROM TRAN_DATE) AS MONTH_2016, SUM(TRAN_AMT) AS
TOTAL
FROM TRANSACT
    INNER JOIN SKU ON SKU.SKU = TRANSACT.SKU
WHERE COLOR LIKE '%AMERICA%' AND TRAN_DATE>= DATE'2016-01-01' AND
TRAN_DATE <= DATE'2016-10-31'
GROUP BY EXTRACT(MONTH FROM TRAN_DATE)
ORDER BY EXTRACT(MONTH FROM TRAN_DATE);
Database: Sam’s Club
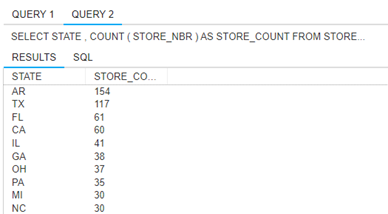
7. How many stores are in each state? Provide a report showing each state and the
number of stores it has. Order by the number of stores, descending (and only
include the first 10 results in your screenshot).
DATABASE WCOB_SAMS_STOREVISITS;
SELECT STATE, COUNT(STORE_NBR) AS STORE_COUNT FROM STORE_INFO
GROUP BY STATE
ORDER BY COUNT(STORE_NBR) DESC;
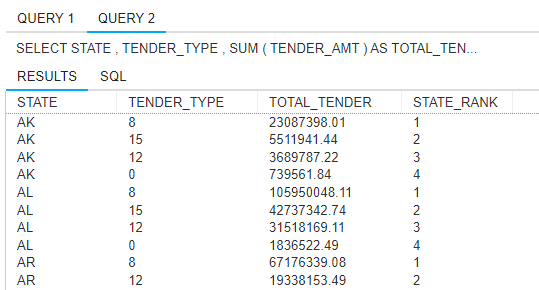
8. We want to know what payment methods people are using around the country.
Produce a state tender ranking report, with each tender type’s rank based on the
amount tendered (sum of tender amount) within their state. Only include our four
most common tender types: 0, 8, 12, and 15. Order the report by state and rank
within the state.
Note: The full result set will contain 196 rows, only include the first 10 in your results.
DATABASE WCOB_SAMS_INTEGRATED;
SELECT STATE, TENDER_TYPE, SUM(TENDER_AMT) AS TOTAL_TENDER,
RANK()OVER(PARTITION BY STATE ORDER BY SUM(TENDER_AMT) DESC ) AS
STATE_RANK
FROM STORE_INFO
    JOIN TENDER ON TENDER.STORE_NBR = STORE_INFO.STORE_NBR
WHERE TENDER_TYPE IN (0,8,12,15)
GROUP BY STATE, TENDER_TYPE
ORDER BY STATE, STATE_RANK;
Building My Own Queries Using Enterprise Datasets
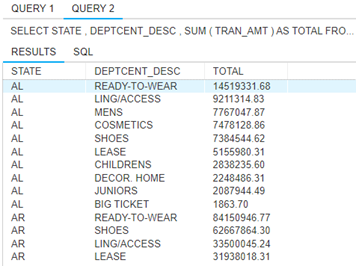
9. Which department century generates the most revenue and from what state is? Provide a ranking of the department century by state and revenue.
SELECT STATE, DEPTCENT_DESC, SUM(TRAN_AMT) AS TOTAL
FROM TRANSACT
    JOIN STORE ON STORE.STORE = TRANSACT.STORE
    JOIN SKU ON SKU.SKU = TRANSACT.SKU
    JOIN DEPARTMENT ON DEPARTMENT.DEPT = SKU.DEPT
GROUP BY STATE, DEPTCENT_DESC
ORDER BY STATE, SUM(TRAN_AMT) DESC;
