Business Case: OzarkWine
Business Scenario
OzarkWine is a local vineyard specializing in both red and white wines. Their goal is to “provide the highest quality wine while perfectly balancing acidity, sweetness, and pallet”. The company has now grown to a point where they would like to incorporate some data analytics to improve their overall process and gain insights to beat out the competition.
Response
To: OzarkWine
From: Ruben Chung, Data Analyst
Date: 16/11/2022
Subject: Insights From OzarkWine Dataset
The purpose of this memo is to recommend OzarkWine to focus on the acidity and sweetness of the wine in order to improve and standout from competition. Although there are more recommendation for white wine than red wine, the evidence shows that both variables impact customers’ choice.
Summary
Based on the evidence, OzarkWine’s dataset of white wine is the triple of red wine. About 66.5% of people recommend white wine while 53% recommend red wine. The higher the quality of the wine, the more recommended.
The acidity of the wine also plays a very important role in the decision for recommending the wine. People tend to recommend more when the wine has a medium to high acidity on both red and white wine.
In addition, customers who select red wine as their recommendation like it on the lower side of sweetness while customers who prefer white wine like it on the sweeter side. Surprisingly, the alcohol content level did not matter in the customers’ choices.
Recommendation
OzarkWine should pay attention to the acidity and sweetness components in the process of making wines since these are the two variables that drive a customer’s decision on recommending a wine selection.
Please, let me know if you have any questions.
Side note: While analyzing the dataset, I found that the best data modeling does not mean the best fit for business purposes. I do not suggest my model since the data says that acidity and sweetness play a very important role in customers’ choice of recommending wine. However, during the data modeling phase, these two variables were not considered the best linear regression model with the lowest root mean square deviation which predicts the accuracy of the data.
Appendix
Data Exploration


The relationship between these two variables; quality and recommend, is that in order to have a higher chance to be recommended, the quality of the wine has to be higher. For example, if I taste a wine and I don’t like it, I won’t probably recommend it to my friends and family the wine I tried. However, if it is what I like, I will recommend it to them. When it comes to data mining tasks, quality is estimation which has value in numbers while recommend is classification because it is categorized as yes/no.
Modeling and Evaluation
Linear Regression: Target = quality
Linear Regression - Normal
Linear Regresion - Backward Selection
Linear Regresion - Forward Selection
Linear Regresion - Stepwise Selection
Logistics Regresision: Target = recommend
Naive Rule
Logistics Regression - Normal
Logistics Regression - Backward Selection
Logistics Regression - Forward Selection
Logistics Regression - Stepwise Selection
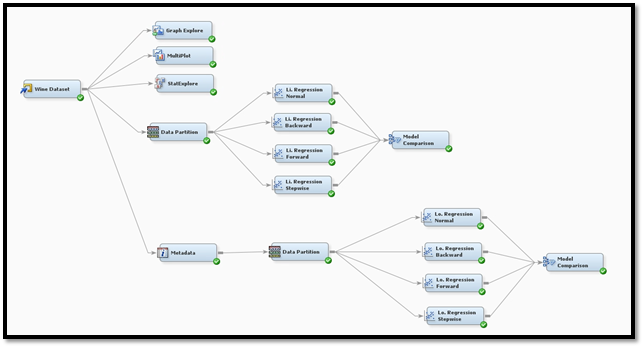
SAS Model Flow

Conclusion
Based on the modeling and evaluation, it seems that Linear Regression - Backward Selection is the best outcome as adjusted r-squared 1 is in between and the validation RMSE 2 is the lowest using the variables listed.
Note that the variables listed in the backward selection both sweetness and acidity are not listed when in a real world scenario they should be considered concluding that sometimes the best modeling is not always the best for a business perspective and judgement should be included.
-
Adjusted R-squared: It calculates if the additional predictors improve a regression model or not. A higher adjusted R-squared means that the model is a good fit ↩
-
Root Mean Squared Error (RMSE): It measures the average prediction error made by the model in predicting the outcome for an observation. In other word, the average difference between the observed known outcome values and the values predicted by the model. The lower the RMSE, the better the model. ↩
